What is Page Experience Report in Google Search Console?
While Google has delayed the launch of the Page Experience Report, it has elaborated on how the report will be evaluated. The report, scheduled to be launched in mid-June 2021, will help businesses to understand the experience of visitors to your site. It measures the users’ experience interacting with your web page beyond the information that has been provided on the page. There are some parameters included that measure the real-world experience. The report is evaluated per URL and is currently only assessed using a mobile browser. The aim to introduce the report is to help websites create user-friendly web pages.
What are the criteria for Page Experience evaluation in Google Search?
Check the list of metrics that Google page report provides data on-
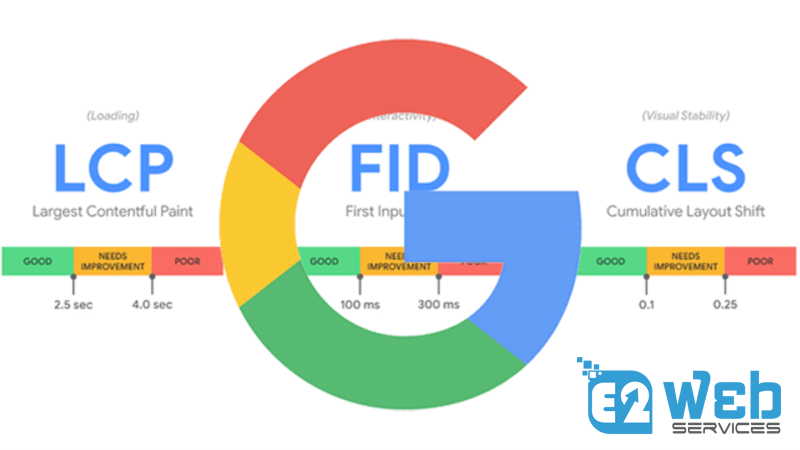
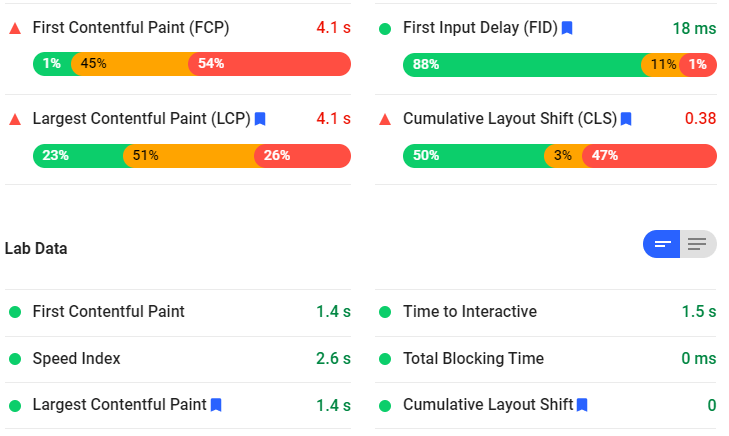
- Core Web Vitals– This includes components like Largest Contentful Paint (LCP), First Input Delay (FID), and Cumulative Layout Shift (CLS). LCP measures the loading performance of a page. Developers should aim to have LCP occur within 2.5 seconds of the page starting to load. FID is for interactivity, which should be less than 100 milliseconds. CLS measures stability, and maintaining a score of less than 0.1 will result in a good user experience.
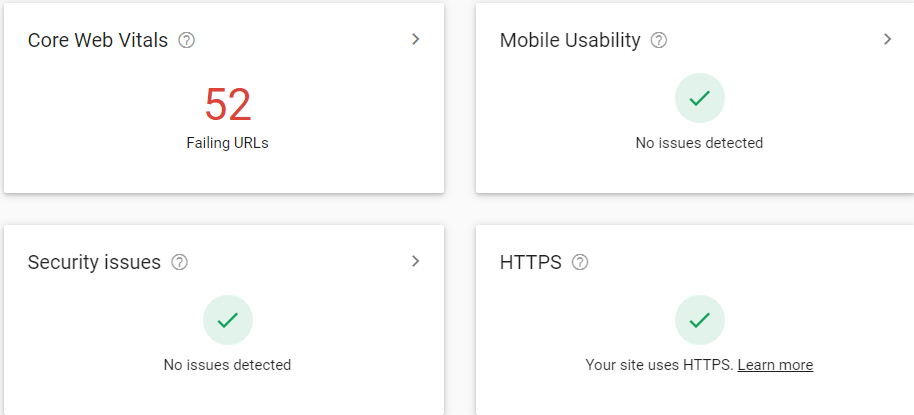
- Mobile usability– Websites should be mobile-friendly and to establish this you can take a mobile-friendly test for your site.
- Safe-browsing– Your page should not contain malicious or deceptive content.
- HTTPS– The page should be secured through HTTPS.
- Absence of intrusive interstitials– The content available on the webpage should be easily accessible to the visitor.
- Ad-Experience– This can affect the whole site, not just a page. This is calculated based on the usage of advertising techniques, which shouldn’t be conducive, interruptive or distracting.
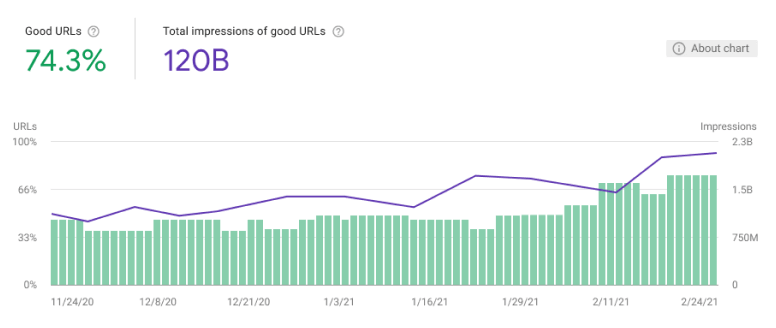
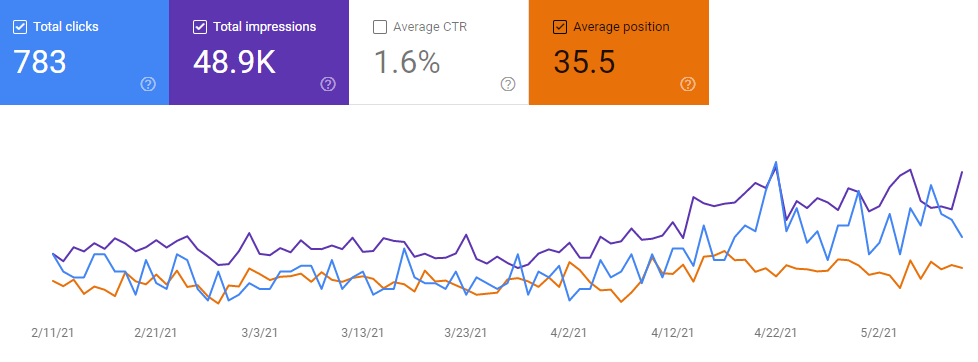
The chart shows the following data-
- Good URLs– These are the URLs, which have a good status in the Core Web Vitals report and do not report mobile usability issues. The other metrics are not included in this category. The percentage of good URLs will be visible to site owners.
- Impressions of Good URLs– The chart will display the number of impressions made by the good URLs over a certain period.
- Daily Values of Chart– The percentage of web pages considered good on a given day.
Changes in Search Performance Report
The updated search performance report allows you to filter pages with good page experience versus pages with other statuses. This will help you to understand how well a page with good user experience performs with respect to poor user experience pages. All these filters will be available in the Search Performance filter area.
How does it impact you?
These new features will help you to understand how to optimize your page better and new ways to look at your web pages concerning the scoring you will be receiving with the page experience updates. With the delay in the rollout of the page experience update, it allows businesses providing SEO services to learn more about these tools and features.

Shyam Kumar is an accomplished author with years of experience in crafting high-quality, engaging content that drives traffic and boosts rankings. He has a keen understanding of search engine algorithms and is skilled at creating content that not only ranks well but also resonates with readers. His dedication and expertise make him a valuable asset to any SEO team.